
Chemistry reports can be created from the “Page Reports” menu item of the “Reports” main menu. The settings allow which parameters to include in the report.
Sites to be included in the reports can either be the current site only or the sites in a View to be selected. The samples to be included in the reports can be restricted by setting the required From and To Dates/Times and also by selecting specific samples with the “Select Samples” button. Only samples (CHM_REF_NR) within the sites of the current site/view will be shown.
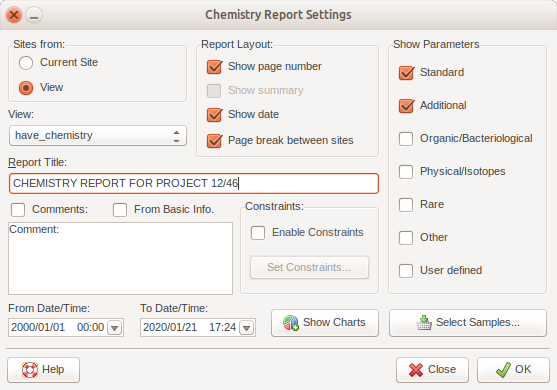
In order to show a maximum of two charts on the report (right under the Basic Information part), the charts can be created and modified with the “Show Charts” button. Once the charts are created they can be modified to display better on the reports by removing the frame (on some charts) and making the background and the panel around the chart a white colour. The chart sizes can also be increased by dragging the form bigger and then adjusting the font sizes to increase the resolution of the chart.
All these can be accessed by right-clicking on the chart, which opens a popup menu. Once the chart(s) have been modified the new settings must be applied by selecting “Update chart for report” from the popup menu. If one or both charts are closed before the report is generated they will not be shown on the report.