The Construction and Lithology chart can not only be accessed through the main menu under Chart, but also from quick chart buttons on construction, geology and aquifer entry forms. The initial settings form allows a comprehensive number of settings for the chart(s), some of which, when changed, will keep the settings when using the charts again.
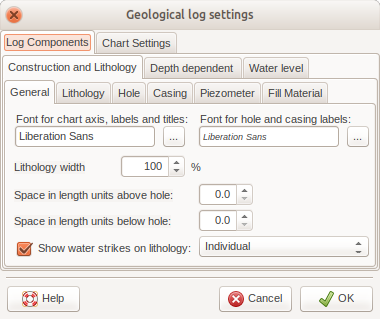
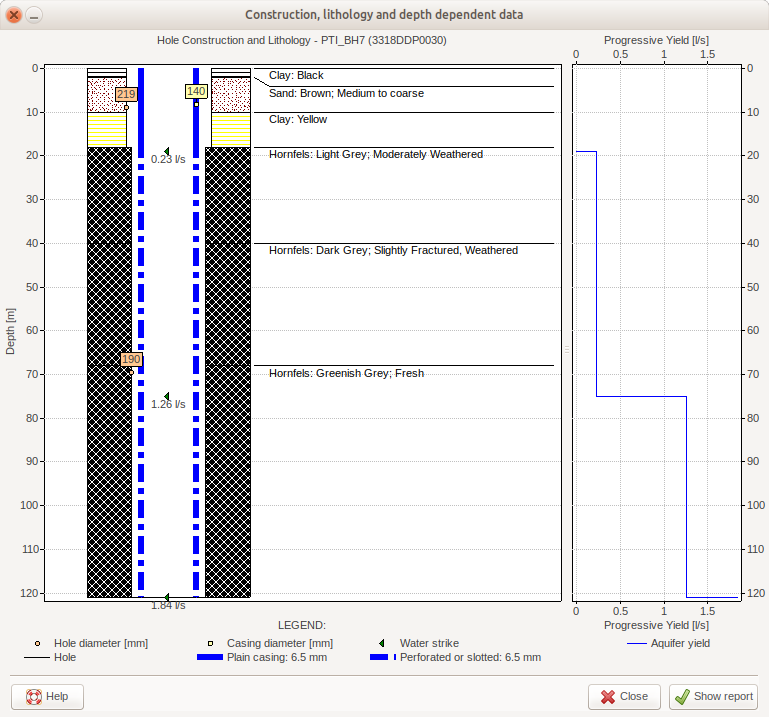
While the default settings may be sufficient for most cases, some log charts may require quite a bit of customisation, especially the ones that have very short distance changes in lithologies,colours, textures etc. For those lithology descriptions can be set to show left and right of the lithology and also directly under the line separating the lithologies, which are then spaced so that descriptions do not overlap.
While the default settings may be sufficient for most cases, some log charts may require quite a bit of customisation, especially the ones that have very short distance changes in lithologies, colours, textures etc. For those lithology descriptions can be set to show left and right of the lithology and also directly under the line separating the lithologies, which are then spaced so that descriptions do not overlap.
But also short distance changes in hole diameters and casings may require adjustment of labels. Most other settings are self-explanatory or have hints (hover over with mouse) to explain what they would be doing.
In order to generate a depth-dependent chart to the right of the lithological log, the chart needs to be enabled and a depth-dependent parameter selected for the top and/or the bottom chart. If only one parameter is selected the top and bottom axes are both labelled with the relevant parameter values and axis title. When selecting two parameters (one for the top, one for the bottom axis) it might be necessary to also specify the maximums for both axis so that the grid lines overlap according to the values of the top and bottom axis; e.g. top axis maximum = 50, bottom axis = 500 (spacing of grid lines for both axis will be the same).
Once the charts are generated a popup menu can be accessed by right-clicking on either of the charts.