This report has several steps to go through before it can be shown. As with the Pumping Test Report the report will be for the current site only as it would be almost impossible to have the same settings for a number of sites.
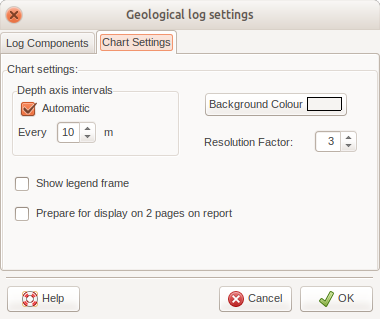
The first step is to set up which charts must be shown and all settings as when creating a Construction and Lithology Chart (see further down). But now it is important to access the Chart Settings tab and tick the “Prepare for display on 2 pages on report” checkbox, but this is only necessary if the lithology log is very complex with a lot of changing lithologies and text. This will make sure that a top and bottom chart (half of the total depth of hole each) for both lithology and depth-dependent chart will be created for use on the report, which then has the option to show the log over the first two pages.
Once the construction/lithology is shown a few settings can be adjusted and the top/bottom parts of the chart extents viewed as the second step.
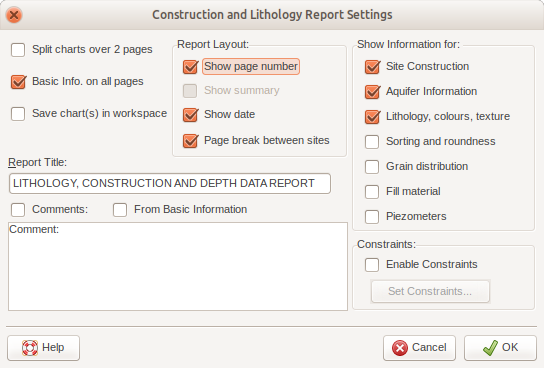
Additionally another button “Show Report” is visible, clicking on which will show the third step, the Report Settings dialog. Most of the settings are self-explanatory, but the top left checkboxes allow:
- Actually allow showing the charts over the first two pages of the report; this is only active if the charts were prepared in the first step
- Show the Basic Information at the top of all pages of the report (default)
- Save the chart(s) as bitmaps in the workspace. If you want to use the charts in another application (must be stitched together) they should be copied out of the workspace as they will be overwritten during a new report generation with this setting ticked.