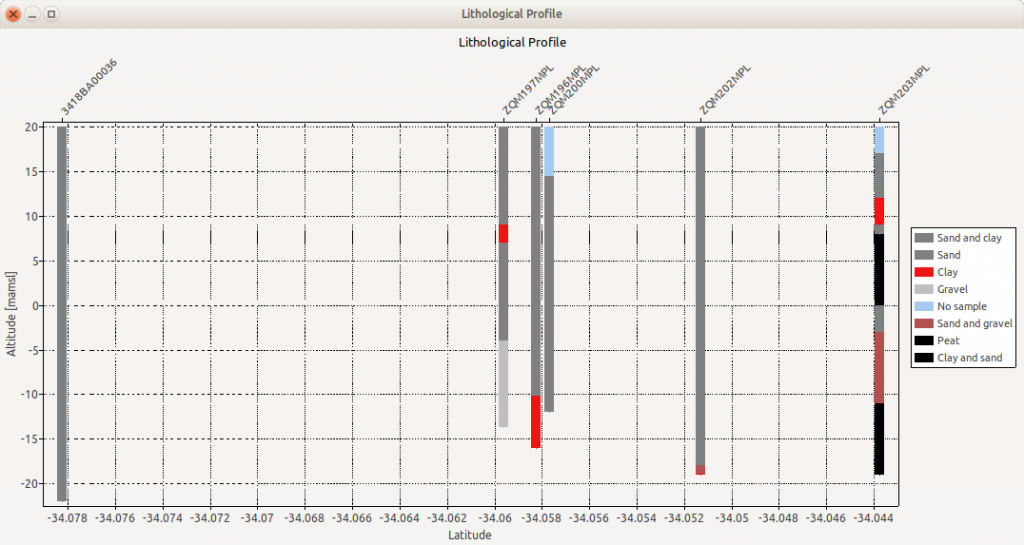
This chart produces a profile of the lithologies of boreholes and wells. The lithologies are represented as thin bars with colours only, so it is important to have as many colours (primary/secondary) defined in the database or the Lookup table. As there is limited space hatch patterns for the different lithologies are not possible.
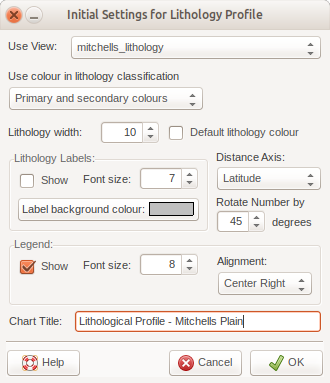
Different classifications of the lithologies can be selected according to lithology only (no colours used), primary colours, secondary colours or both used to further distinguish between lithologies. But by checking the checkbox “Default lithology colour” the colour stored in the Lookup codes for these particular lithologies are used, rather than the colours stored in the database.
Different classifications of the lithologies can be selected according to lithology only (no colours used), primary colours, secondary colours or both used to further distinguish between lithologies. But by checking the checkbox “Default lithology colour” the colour stored in the Lookup codes for these particular lithologies are used, rather than the colours stored in the database.
The bottom (distance) axis can either display the Longitude (if the profile is more “horizontal”) or Latitude (if the hole lithologies in the profile are more “vertical”). The top axis of the chart is used to display the Site Numbers (NR_ON_MAP) and if the holes are too close together the resulting overlapping labels can be rotated anti-clockwise.
Lithology labels and Legend settings can also be adjusted to increase e.g. fonts or colours and the chart title can be changed to be more specific.