
The pumping test report is for the display of aquifer test pumping information with water level/drawdown charts.
There are two charts which can be displayed; one for multirate/step/calibration tests and one for constant rate tests. It is important to select the correct time settings, which Aquabase tries to fill into the date/time dropdown boxes automatically. This works for most cases but if there are more than one multirate/step/constant rate test then user interaction is required.
By default only the pumping test data and details for the tests selected within the date/time ranges and displayed on the charts will be shown as data on the report, but this can be overridden by checking the checkbox “Show data from all pumping tests”.
For step tests the “Plot Steps” spinner can be set to show step details of any ADDITIONAL steps over and above the first one as additional separate lines on the Multirate/Step chart.
Discharge rates can also be shown on the charts with either a line or as area, but this may require a zero (0) discharge rate at the end of each test as otherwise the discharge rate chart line/area may be shorter than the water level/drawdown lines.
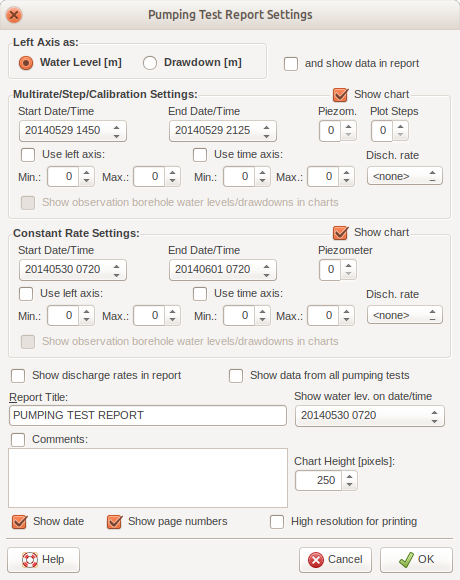
The “Show water lev. on date/time” dropdown allows the selection of the water level to be shown in the Basic Information header section of the report. By default the last water level is shown in the dropdown and the report. This can either be the last static (“S”) or dynamic (“Y”) water level, but any other water level of this status may be selected for the report.
The “High resolution for printing” should be used for the final report (if everything works and is displayed with the settings as expected) as this setting improves the resolution of the charts dramatically, but also takes longer to produce the report.