This simple mapping tool allows quick and easy viewing of the workspace data on a map, which can be a number of online maps including OpenStreetMap, OpenTopoMap, Google Maps, Bing/Virtual Earth Maps and others. Theoretically any other online maps can be added to the configuration file map-providers.xml, which resides in the workspace folder once any map has been opened and closed again.
PLEASE NOTE THAT IT MAY BE NECESSARY FROM TIME TO TIME TO RELOAD THE VIEW AND MAP DUE TO THE MAPS BEING ONLINE AND DEPENDENT ON DOWNLOAD. THE POINTS MAY SOMETIMES NOT UPDATE SHAPE OR COLOUR SO THIS FUNCTION WILL HELP WITH A REDRAW.
Additionally a mapview.ini file will be created, which stores the settings of a map, including which map was used and what size the map window was at the time of leaving the map.
Maps can be created through several menu options:
1.) Show the current site on the map (quickly see where the coordinates are plotting)
2.) Show the sites in the current View on the map (when using a view with over 5000 sites the user is warned that creating the map make take a few seconds to more than a minute)
3.) Show “allsites” View on the map (useful if the current view is not “allsites”)
4.) Graduated Points on a map
5.) Categorised Points on a map
While using the first three methods are self-explanatory the fourth and fifth require a few settings before the maps can be created (please see Help items below). When creating any of the first three option maps the current site is displayed with a default yellow colour. All other sites are displayed in the colour as selected with the Point Colour button on the Map and Data Tab (this setting is stored when closing the map). Ctrl-clicking on any site will move the dataset to that site so one can immediately see the data attached to that site on any other open entry forms.
On this tab any other View can be selected, which immediately changes the sites visible. The extent of the map will automaticcally zoom to the extent of the sites in the selected View. Point sizes can also be adjusted and various zoom settings selected. A simple legend of the points displayed can also be shown by clicking the relevant button (opens a separate legend window).
Hovering the mouse over a site provides the Site Identifier and Number (in brackets) as a hint, but also in a list at the Tab bottom (even more than one site within the cursor search radius). Clicking the List button opens another window with a list of all sites in the View selected.
The “View and Search” tab provide information about the mouse position and the center of the map (both in real coordinates) and the viewport (map) width and height. But it also allows to search for anything on the map by using OpenStreetMap points of interest. Once a location is found it can be selected and the map will focus on that location.
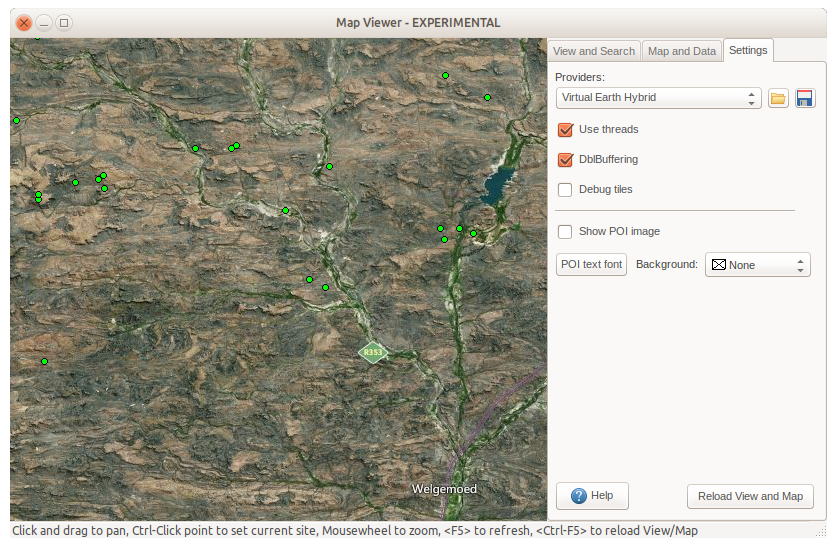
The “Settings” tab allow the selection of background map provider. The provider settings can be saved in the workspace or the default providers loaded with the relevant buttons. The other functions are mainly for performance purposes or show (debug) the actual tile borders of the downloaded tiles.